

Project management is about preparation and execution. However, no matter how far you can envision scenarios and make plans, you cannot make yourself immune to problems you can’t foresee. This is why you must use the Program Evaluation and Review Technique (PERT) in Project Management to eliminate all project uncertainties. Continue reading below to start implementing PERT in your work and deal with uncertainty to complete your projects successfully.
What is Program Evaluation and Review Technique (PERT) in Project Management?
The Program Evaluation and Review Technique (PERT) is a project management tool used to estimate project timelines and identify critical paths. This is particularly helpful for projects with inherent uncertainties in work duration.
The US Navy developed this approach in the 1950s, which was initially used to address community issues and later as a tool to manage certain projects. 2 reasons make PERT very attractive. The first reason is its probabilistic approach, which differs from Gantt Charts, which are usually based on constant duration. The second is its adaptability to dynamic plans. PERT uses three time estimates for each activity, including:
- Optimistic Time (tO) – the shortest time in which a task can be done ideally
- Most Likely Time ™ – the most realistic estimate under average conditions
- Pessimistic Time (tp) – the longest possible time due to challenges.
Based on these figures, PERT calculates the expected time for each activity and the project’s total time to completion. This approach provides a realistic depiction of the project flow, minimizing the likelihood of underestimations due to unexpected challenges.
Also Read – What is a Project Management Information System (PMIS)?
What Does a PERT Chart Contain?
One crucial part of PERT is visualizing the project plan using a PERT chart. This chart shows the project as a series of connected activities shown by nodes or boxes. Arrows between these nodes indicate task dependencies, showing which tasks must be finished before others can start. The PERT chart includes these essential elements:
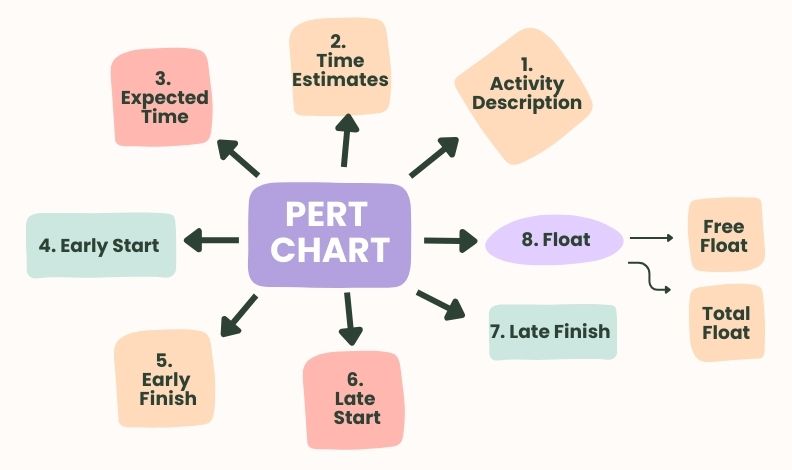
- Activity Description: A brief description of the nodes’ tasks.
- Time Estimates (TE): Those refer to the optimistic, most likely, and pessimistic time estimates (to, tm, tp ) indicated under each task.
- Expected Time: It is calculated using the following formula: TE = (to + 4tm + tp) /6. ET is, therefore, the earliest time expected for a task to be completed.
- Early Start: ES refers to the earliest time a task can start, considering its predecessors.
- Early Finish: EF refers to the earliest a task can be finished and is calculated as EF= ES + TE for that task.
- Late Start: It is the latest time that a task’s completion will delay the start of the next task. Thus, the formula used to calculate LS = Maximum Duration – TE.
- Late Finish (LF): The last time a task can finish without delaying the project’s completion, determined by taking away the total float of the project from Early Finish (EF).
- Float: This demonstrates flexible scheduling for a particular activity or job. There are two types of floats:
- Free Float: Time within which an activity may be delayed without impacting subsequent activities that fall along the critical path.
- Total Float: The aggregate amount of time an activity may be delayed beyond its earliest start and latest finish dates without affecting the project’s completion date.
How PERT Charts Work?
Creating a PERT chart involves these steps:
- Identify Tasks: Break down the project into manageable tasks, clearly defining what each task needs to achieve.
- Define Relationships: Figure out how tasks are connected. Some tasks may need others to finish before they start, while others can be done independently or simultaneously.
- Draw the Chart: Make a network diagram using project management software or drawing tools. Tasks are nodes linked by arrows to indicate dependencies.
- Estimating Time: Assign tasks to tm, tp for each, based on expert judgment or historical data (if available).
After drawing the PERT chart, you can calculate the Expected Time (TE) using the earlier formula. Then, determine Early Start (ES), Early Finish (EF), Late Start (LS), Late Finish (LF), and Float for each task.
Also Read – Key Performance Indicators in Construction
When to Use a PERT Chart?
PERT charts are handy for projects with the following characteristics:
- High Uncertainty: When task durations are hard to predict due to complexities or a lack of past data, PERT charts give a more realistic view using probabilistic estimates.
- Large and Complex Projects: PERT charts visually represent the flow of big projects with many interconnected tasks, aiding in planning and resource management.
- Research and Development Projects: Innovation projects are naturally uncertain. PERT charts help handle uncertainties and adjust plans based on ongoing discoveries.
While PERT charts have many benefits, they’re unsuitable for every project. Consider using Gantt charts for projects with apparent durations and few dependencies.
PERT Chart Example
Let’s take the example of building a new hospital! A PERT chart can help visualize the entire project and identify critical tasks. Here’s an example focusing on the initial steps:
Key Stages:
- Permits (A): Get building approvals! (1-4 weeks)
- Site Preparation (B): Prepare the land for construction. (3-6 weeks)
- Materials (C): Order all the building supplies. (2-5 weeks)
- Foundation (D): The hospital’s strong base. (4-8 weeks)
- Framing (E): The building’s skeleton (structure) takes shape. (3-6 weeks)
- Electrical (F): Wires and outlets go in after B & C. (2-4 weeks)
- Plumbing (G): Pipes and water systems follow B & C. (2-4 weeks)
- HVAC (H): Heating, ventilation, and air conditioning come last. (1-3 weeks)
Connections:
- B (Site prep) needs permits (A) first.
- C (Materials) can happen alongside B.
- D (Foundation) relies on finished site prep (B).
- E (Framing) needs a completed foundation (D).
- Electrical (F) and Plumbing (G) can start after B & C are done.
- HVAC (H) waits for both electrical and plumbing to be finished.
Critical Path:
The critical path is the longest series of tasks that directly impact the project timeline. Here, the possibility is A -> B -> D -> E. Delays in these stages will set back the entire project.
There are many more tasks and dependencies involved in real-world building. But PERT charts can provide a clearer view, helping project managers focus on critical areas and avoid delays.
Also Read – What Is a CMMS? Meaning, Benefits, Features, and Examples
Advantages of PERT Charts
- Handles Uncertainty: PERT charts give a more realistic view of project timelines using probable time estimates.
- Better Risk Management: By identifying the path of activities that would delay a project, PERT charts help manage risks.
- Clear Communication: PERT charts make project scope, dependencies, and timelines clearer.
- Adaptability: PERT charts can be updated with new information acquired as well as when seen from different contexts of the project’s progress.
Disadvantages of PERT Charts:
- Time-Consuming: For complex projects, creating and updating PERT charts might consume a lot of time.
- Data Reliance: The accuracy of PERT analysis depends on the quality of time estimates.
- Resource Limitation: PERT charts focus mainly on task durations and dependencies, offering limited help with resource allocation.
- Need for Software: Creating and analyzing complex PERT charts requires specialized project management software.
PERT Chart vs. Gantt Chart
While both PERT and Gantt charts are helpful in project management, they have different uses:
- PERT Charts: Emphasize task relationships and flexible timelines, useful for uncertain projects.
- Gantt Charts: Display project schedules with fixed durations, suitable for projects with clear timelines.
Feature | PERT Chart | Gantt Chart |
Full Form | Program Evaluation and Review Technique | Named after Henry Gantt |
Purpose | Focuses on task sequencing and time estimation under uncertainty | Focuses on task scheduling over a timeline |
Representation Style | Network diagram (flowchart format) | Bar chart (horizontal bars) |
Focus | Task dependencies and project milestones | Task duration and progress |
Best For | Complex projects with interdependent tasks and uncertain timelines | Projects with clearly defined tasks and timelines |
Visual Layout | Shows nodes (events) and arrows (activities) | Shows tasks on a calendar with bars showing duration |
Time Estimation | Includes optimistic, pessimistic, and most likely time estimates | Typically uses fixed start and end dates |
Critical Path Identification | Clearly identifies the critical path and slack time | Does not highlight the critical path |
Use Cases | Does not clearly highlight the critical path | campaigns |
Choosing between these tools depends on the project’s needs. PERT charts are more adaptive for uncertain projects, while Gantt charts give an easy view of projects with clear timelines.
Project Evaluation and Review Technique (PERT) vs. Critical Path Method (CPM)
PERT and Critical Path Method (CPM) are methods for scheduling a project by finding its critical path and monitoring the time it takes for each activity to be completed. However, they vary in how they estimate task durations:
- PERT: Uses a probabilistic method, considering optimistic, most likely, and pessimistic task durations.
- CPM: Uses a deterministic method, needing a single, fixed time estimate for each task.
Here’s a table summarizing the key differences between PERT and CPM:
| Feature | PERT | CPM |
| Time Estimates | Optimistic, Most Likely, Pessimistic | Single, Fixed Duration |
| Suitable for Projects | High Uncertainty, Research & Development | Well-defined Tasks, Construction |
| Data Requirements | Less Data Required | More Historical Data Needed |
| Focus | Risk Management and Flexibility | Efficiency and Cost Optimization |
Choosing between PERT and CPM depends on the project’s characteristics:
- Use PERT for projects with high unpredictability and limited historical data.
- Use CPM for projects with clear tasks, predictable durations, and a focus on cost control.
Sometimes, project managers might blend aspects of both methods. For example, they might use PERT’s probabilistic approach for high-risk tasks and CPM’s fixed approach for well-defined tasks.
Conclusion
The Program Evaluation and Review Technique (PERT) is a valuable tool in managing uncertain projects. Probabilistic time estimates and task dependencies make PERT charts realistic and show possible conflicts, This four-way process helps managers understand cause and effect sequence better than Gantt charts in order to make effective decisions, such as prioritizing tasks, risk management, or finished projects.
OnIndus, a top project management consultant, helps clients use PERT and other methods effectively. Contact us to see how we can assist you in managing complex projects and achieving success.
FAQs
What are the six steps in PERT?
The six steps in PERT can be summarized as follows:
- Identify project activities.
- Determine dependencies between activities.
- Draw a PERT chart illustrating activities using nodes connected via arrows symbolizing dependencies.
- Allocate optimistic, most likely, and pessimistic time estimates for each activity.
- Use the PERT formula to determine the Expected Time (TE) for every activity.
- Critical path analysis should be carried out to identify bottlenecks in project planning.
What is PERT in project management with an example?
The blog post explains PERT in project management and gives a simple marketing campaign example. This example shows how PERT charts use task relationships and probability estimates to find the critical path and total project time.
What is PERT vs CPM?
PERT and CPM are both project scheduling techniques that calculate critical paths. PERT uses three different time estimates- optimistic, most likely, and pessimistic while CPM provides only one estimate per activity. PERT is suitable for uncertain projects, and CPM works well for clear projects focused on cost efficiency.
What is the PERT formula?
The PERT formula for calculating the Expected Time (TE) of an activity is: TE = (to + 4tm + tp) / 6
Where:
- TE = Expected Time
- to = Optimistic Time
- tm = Most Likely Time
- tp = Pessimistic Time
How does PERT differ from the Critical Path Method (CPM)?
PERT focuses on time estimation using probabilities, ideal for uncertain tasks. PERT CPM deals with fixed durations and cost control. While PERT project management is better for research and development, CPM is often used in construction. Both PERT and CPM help identify the project’s critical path but use different approaches.
When should PERT be used?
PERT should be used when task durations are uncertain or highly variable. This makes the PERT technique perfect for research, new product development, or innovative projects. The PERT tool allows teams to plan realistically using probability, which is especially useful in early-stage or exploratory project management scenarios.
How is the expected time for a task calculated in PERT?
In the Program Evaluation and Review Technique (PERT formula, the expected time (TE) for a task is calculated using a weighted average of three time estimates: optimistic (O), most likely (M), and pessimistic (P). The formula is TE = (O + 4M + P) / 6. This formula gives the most likely time estimate the most weight, recognizing that it’s the most probable duration for completing the task.
How do you determine the critical path in a PERT chart?
Identifying the critical path in a PERT chart requires users to create and calculate durations for every possible path before determining the path with the longest time frame. The critical sequence reveals all tasks that directly affect the project duration. The critical path analysis tool available in PERT and CPM guides users toward effective schedule management.
What are the advantages of using PERT?
The scheduling method of PERT provides accurate results by accounting for uncertainty. PERT proves useful in projects featuring complex activities or those with uncertain time requirements. Through PERT evaluation, organizations achieve advanced risk analysis while developing superior project planning capabilities that enable delay projections from managers. Project management PERT tools serve as excellent visual aids to break tasks into parts and display relationship connections between them.
Are there any limitations to using PERT?
Yes, while PERT is useful, it can be time-consuming and overly optimistic if input estimates are inaccurate. Also, it doesn’t account for resource allocation. Despite being a powerful PERT management method, it works best when paired with other tools for more grounded project control.
Can PERT be integrated with other project management tools?
Absolutely! PERT is a suitable component when combined with Gantt charts, CPM scheduling tools, or specialized scheduling software platforms. Current project management solutions provide PERT tools that help users view and analyze time-driven projects. Integrating PERT technology with Microsoft Project or Primavera enhances team abilities to handle project time requirements alongside resource allocation and risk mitigation functions.
When using pert for solving a large and complex problem, what is your last Step?
A PERT program for large problems requires reviewing and adjusting the plan according to actual project development. The analysis of PERT management concludes with continuous assessment, which validates that the project remains on track with its objectives and timeframes.
What does pert mean in project management?
In project management, PERT stands for Program Evaluation and Review Technique. It is an evaluation method for predicting task durations when complete clarity about durations remains uncertain. PERT serves project management by allowing teams to assess schedules and interdependent tasks, which simplifies the management of challenging projects with unclear deadlines and assignments.
What is a pert analysis?
PERT analysis is the process of evaluating project tasks using optimistic, most likely, and pessimistic time estimates to forecast project completion. An example of a PERT analysis might be software development, where time is uncertain. This technique helps managers identify potential delays and plan more effectively using probabilistic data.